Activity 4: Business Operations – Quality of Performance
Business Studies Grade 11
Activity Purpose
To develop learners' ability to transform raw business data into meaningful visual insights, acting as Business Analysts who create a performance dashboard and make evidence-based recommendations.
Learner Engagement
Learners act as Business Analysts for FreshFizz Beverage Co., analysing raw data on sales revenue, material costs, customer complaints, product returns, employee absenteeism, and satisfaction ratings to create a comprehensive Business Performance Dashboard.
Teacher Role
The teacher introduces the scenario and data set, demonstrates basic Excel charting techniques, provides guiding questions for analysis, and facilitates discussion of findings and recommendations.
Digital Tools
Microsoft Excel (data visualisation and charting)
Activity Brief
Scenario: FreshFizz Beverage Co. , Learners receive a data set containing six months of business performance data.
The data set includes the following metrics:
- Sales Revenue (monthly figures)
- Material Costs (monthly expenditure)
- Customer Complaints (monthly count)
- Product Returns (monthly count)
- Employee Absenteeism (monthly percentage)
- Customer Satisfaction Rating (monthly score out of 10)
Learners must create at least three different types of charts to visualise different aspects of the data, then write an analytical report identifying trends, patterns, and areas of concern, concluding with evidence-based recommendations.
Example of Learner Work
An illustration of how the completed activity looks using the digital Mind Tool.
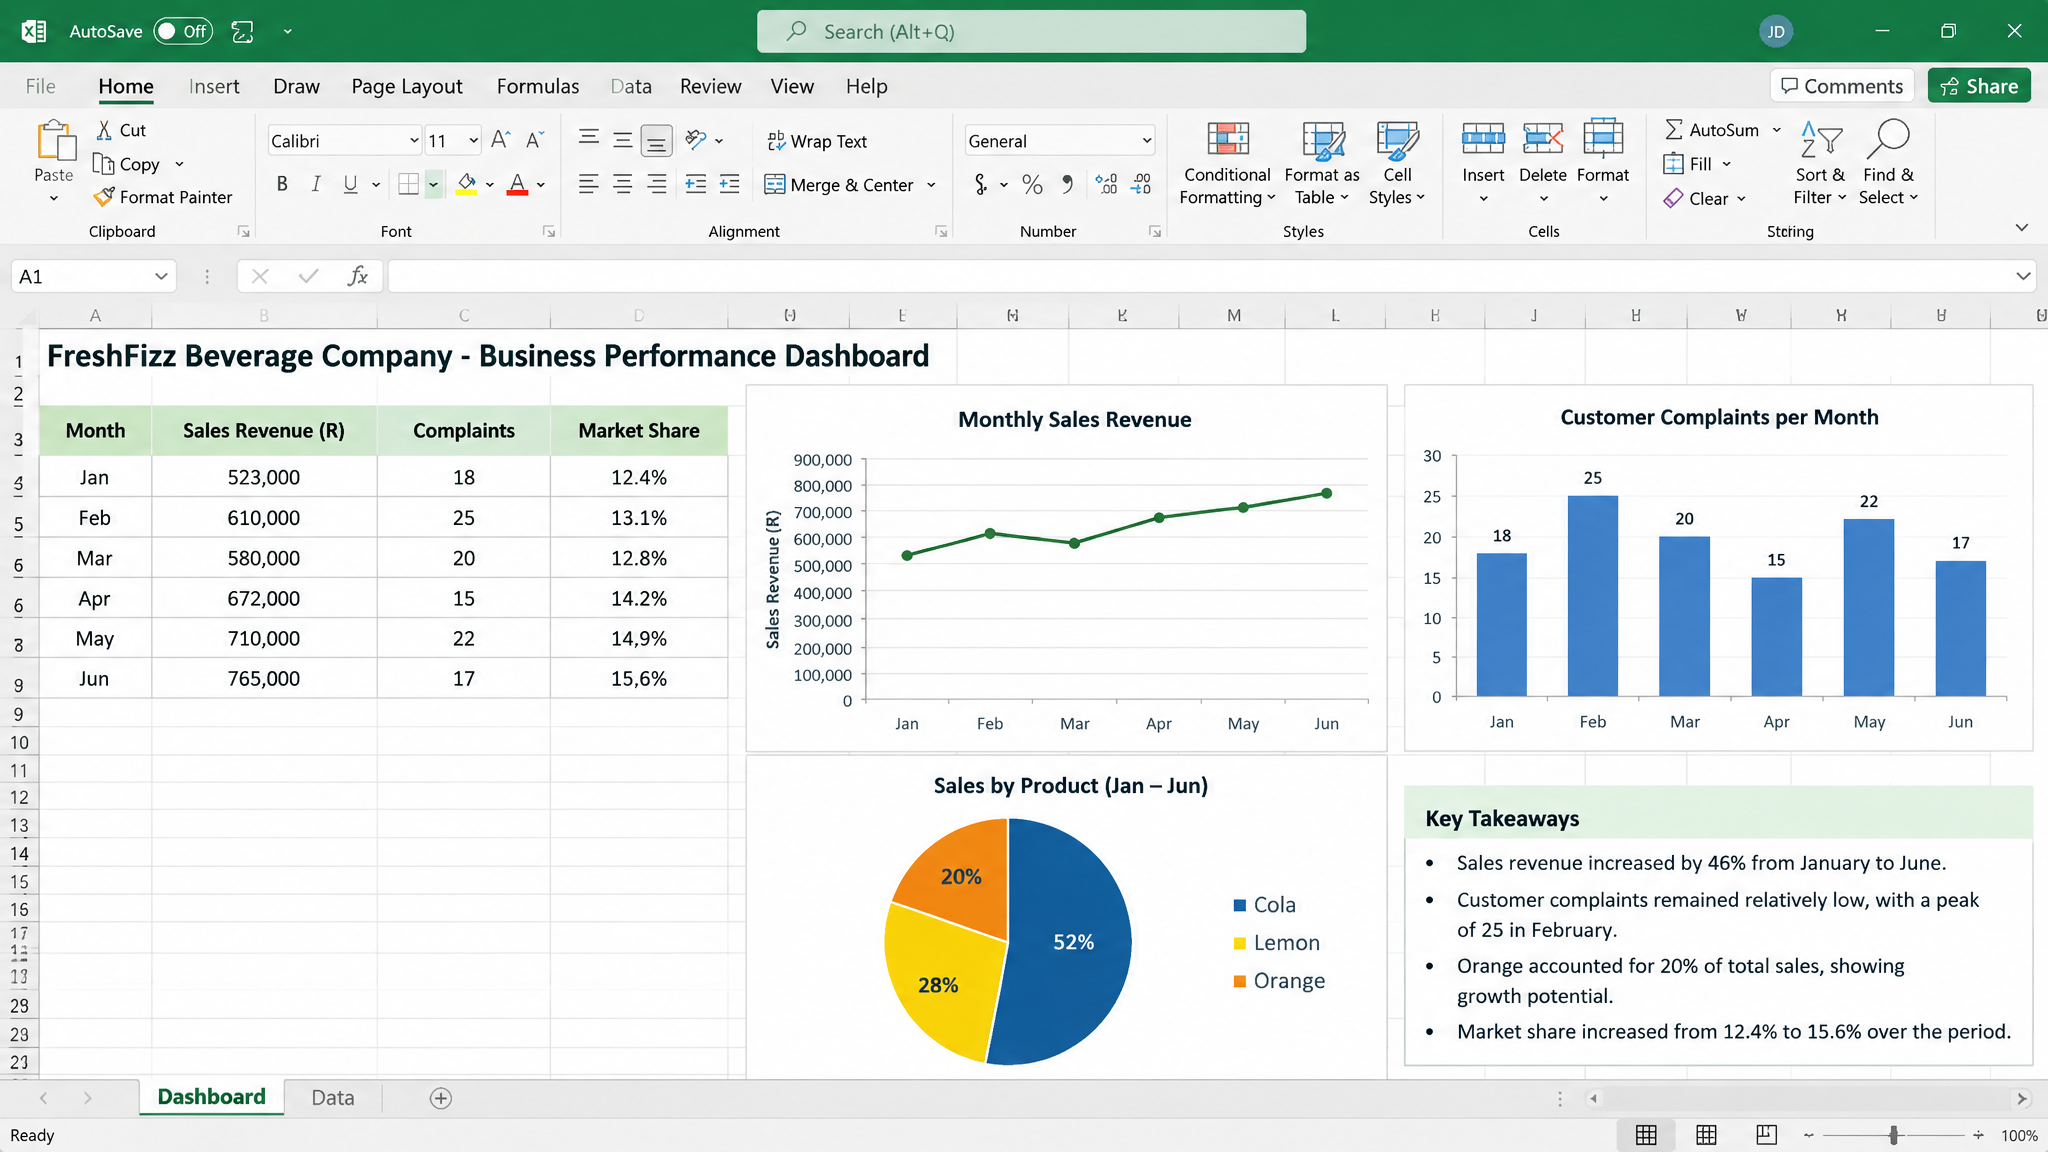
Sample Dashboard: FreshFizz Performance
Below is an example of the type of Business Performance Dashboard learners would create, visualising key metrics for FreshFizz Beverage Co.
MindTool Characteristics
How this activity demonstrates the three defining features of cognitive tools.
Representation
Graphs and charts convert abstract numerical data into visual formats. Patterns, trends, and anomalies that are invisible in raw numbers become immediately visible and interpretable when represented graphically.
Distributed Cognition
The cognitive load is distributed between the learner, the software, and the data. Excel handles the mathematical computations and visual rendering, allowing the learner to focus on interpretation, analysis, and strategic thinking.
Interactivity
Learners actively change graph types, compare variables, add trendlines, adjust scales, and experiment with different visual representations. This manipulation deepens their understanding of the data.